
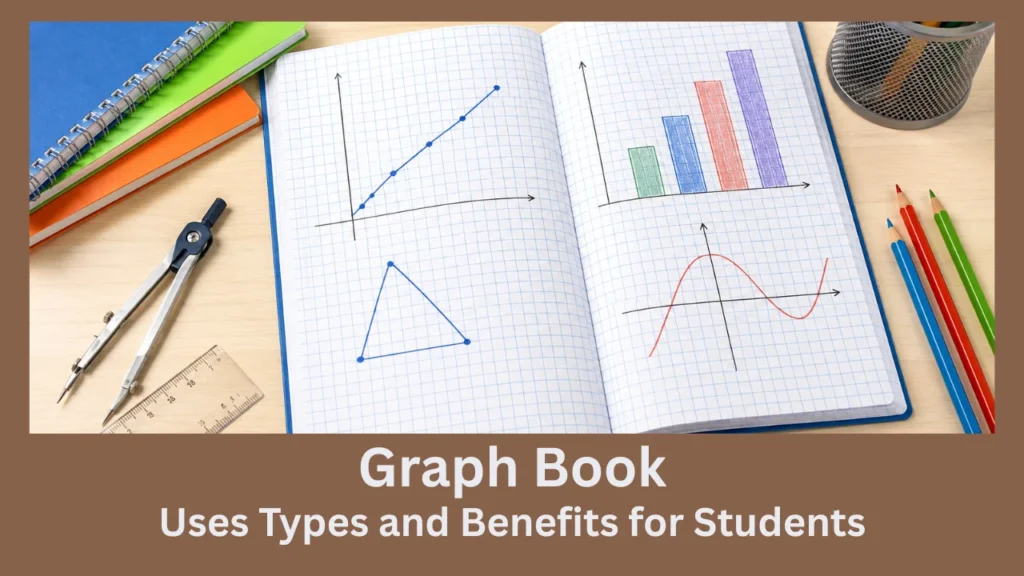
Students use many notebooks for different subjects, and a register book is often useful for long notes and written work. A graph book, however, has a special grid pattern that helps students draw graphs, charts, shapes, and diagrams accurately.
The pages contain evenly spaced horizontal and vertical lines that create small squares. These squares provide a clear guide for measurements, plotting points, and keeping mathematical work neat.
What Is a Graph Book?
A graph book is a notebook filled with graph paper rather than ordinary ruled or blank pages. Graph paper is also called grid paper, squared paper, or coordinate paper because its lines form a regular grid. Students commonly use these pages in mathematics, science, engineering, and laboratory work. The grid makes it easier to plot data, draw curves, write mathematical work, and create accurate diagrams.
The squares can have different measurements depending on the notebook. 5 mm grids are common for everyday mathematics, while finer grids are useful for detailed technical work.
Main Features of Graph Books
The most noticeable feature is the square grid printed across each page. Each horizontal line crosses a vertical line at a fixed distance, creating equal spaces across the sheet. This regular pattern makes the page act like a simple measuring guide. Students can count squares to estimate distance, organize numbers, or position points at specific coordinates.
Some versions also contain darker lines after a certain number of small squares. These major lines make larger sections easier to see and help users count distances without losing their position.
| Feature | Purpose |
|---|---|
| Square grid | Keeps drawings and calculations aligned |
| Equal spacing | Helps with measurement and scale |
| Fine lines | Supports accurate plotting |
| Major grid lines | Make larger sections easier to count |
| Bound pages | Keep classroom work together |
| Different grid sizes | Support simple or detailed work |
Why Students Use Graph Books
A graph book gives students a structured space for mathematical and scientific work. Instead of trying to draw straight lines on blank paper, they can follow the printed grid. This structure becomes especially useful when students study coordinates. They can draw the x-axis and y-axis, select a suitable scale, and then place points in their correct positions.
Grid paper can also help students visualize mathematical relationships and organize information. It supports spatial reasoning and allows learners to focus more closely on the problem itself.
Graph Books for Mathematics
Mathematics is one of the most common subjects where grid-based notebooks are useful. Students can use them for algebra, coordinate geometry, statistics, transformations, and many other topics. For example, a student may need to plot the points (2, 3) and (5, 6). The squares provide clear reference points, making it much easier to place each coordinate accurately.
Students can also use the grid to study area, perimeter, slope, distance, reflection, rotation, and dilation. Geometry becomes easier to check because points and lines can follow fixed positions on the grid.
Using Graph Books for Charts and Data
Graphs help turn numbers into visual information. Bar graphs, line graphs, scatter plots, and other charts can show patterns that may be difficult to notice in a table of numbers. A student can choose a scale and write values along the axes before plotting the data. Equal squares help maintain consistent spacing between numbers and categories.
This is especially helpful when comparing values or tracking changes over time. A neatly prepared chart can make a school assignment or project much easier to understand.
Graph Books in Science
Science students often collect numerical information during experiments. They may record temperature, distance, time, mass, speed, or other measurements and then display the results visually. A graph book allows them to plot experimental values and examine how two variables are related. Graph paper is commonly used for experimental data and laboratory work.
For example, students might measure temperature every five minutes during an experiment. They can place time on the horizontal axis and temperature on the vertical axis to see how the value changes.
Graph Books for Engineering and Technical Work
Engineers and technical students often need greater precision than ordinary notebooks provide. Grid-based paper helps them organize calculations, measurements, diagrams, and early design ideas. Engineering paper may use fine minor lines with darker major lines at regular intervals. This arrangement allows the user to work on small details while still seeing larger measurement blocks clearly.
Special grids can also support circuit diagrams, mechanical sketches, and technical drawings. However, professional final designs are often produced with specialized digital tools rather than notebook paper.
Common Types of Graph Paper
| Type | Common Use |
|---|---|
| 5 mm square grid | School mathematics and general work |
| 10 mm grid | Large diagrams and younger learners |
| 1 mm grid | Detailed plotting and technical work |
| Engineering grid | Calculations and technical sketches |
| Isometric grid | 3D drawings and design |
| Polar grid | Angles and radial data |
| Logarithmic grid | Data across large numerical ranges |
| Dot grid | Sketches, layouts, and organized notes |
How to Use a Graph Book Correctly
Before drawing a graph, decide which information belongs on each axis. The independent value usually appears on the horizontal axis, while the measured or dependent value commonly appears vertically. Next, choose a scale that allows the available data to fit comfortably on the page. Keep the intervals equal and clearly label the axes with the correct quantities and units.
Plot each point carefully at the correct grid intersection. Add a suitable title and any labels needed to help another person understand the information.
Graph Book vs Regular Notebook
| Graph Notebook | Regular Notebook |
|---|---|
| Contains square grids | Usually contains horizontal lines |
| Ideal for plotting data | Ideal for written notes |
| Helps with measurement | Mainly supports handwriting |
| Useful for diagrams | Less suitable for precise diagrams |
| Supports coordinate work | Better for paragraphs and essays |
| Common in math and science | Used across most subjects |
Graph Book vs Graph Paper Sheets
Loose graph paper and bound notebooks provide the same basic grid, but their formats are different. Loose sheets can be removed, submitted, printed, or organized separately. A bound notebook keeps several pages together in one place. This makes it convenient for students who complete graphs regularly during a school term.
Graph paper is available in both loose sheets and bound notebooks. The choice mainly depends on whether the user wants flexibility or a permanent collection of work.
How to Choose a Good Graph Book
A good graph book should match the work you plan to complete. School students can usually start with a standard square grid unless their teacher requests a specific measurement. Check the grid spacing before buying because different grid sizes suit different tasks. Smaller squares provide more detail, while larger squares can be easier for younger students to see and count.
Paper quality also matters when using ink or markers. Stronger paper can reduce ink showing through and can make a notebook last longer during regular classroom use.
Who Should Use Graph Books?
A graph book is especially helpful for school students, college learners, science students, engineering learners, and people working with visual data. Artists and designers may also use grids for layouts, patterns, and proportional sketches. Younger learners can use larger grids for basic shapes, coordinates, area, and perimeter. Advanced students may need smaller grids or specialized formats for detailed mathematical and technical work.
The important factor is choosing a grid that matches the task. A simple school exercise does not require the same level of detail as an engineering drawing.
Conclusion
A graph book is more than a notebook filled with squares. Its structured grid supports accurate graphs, diagrams, coordinates, measurements, calculations, and data displays.
Students can use it across mathematics, science, statistics, and technical subjects. Choosing the correct grid size and scale makes the page even more useful for clear and accurate work.